

I owe you a correction. In May 2025 we published a guide to the VC Method and said investors target a 25% to 40% annual return. That range fits companies nearing an IPO. For a seed round, Aswath Damodaran’s teaching tables at NYU Stern put the target at 50% to 70%, and over a seven-year hold that gap compounds into a very different price.
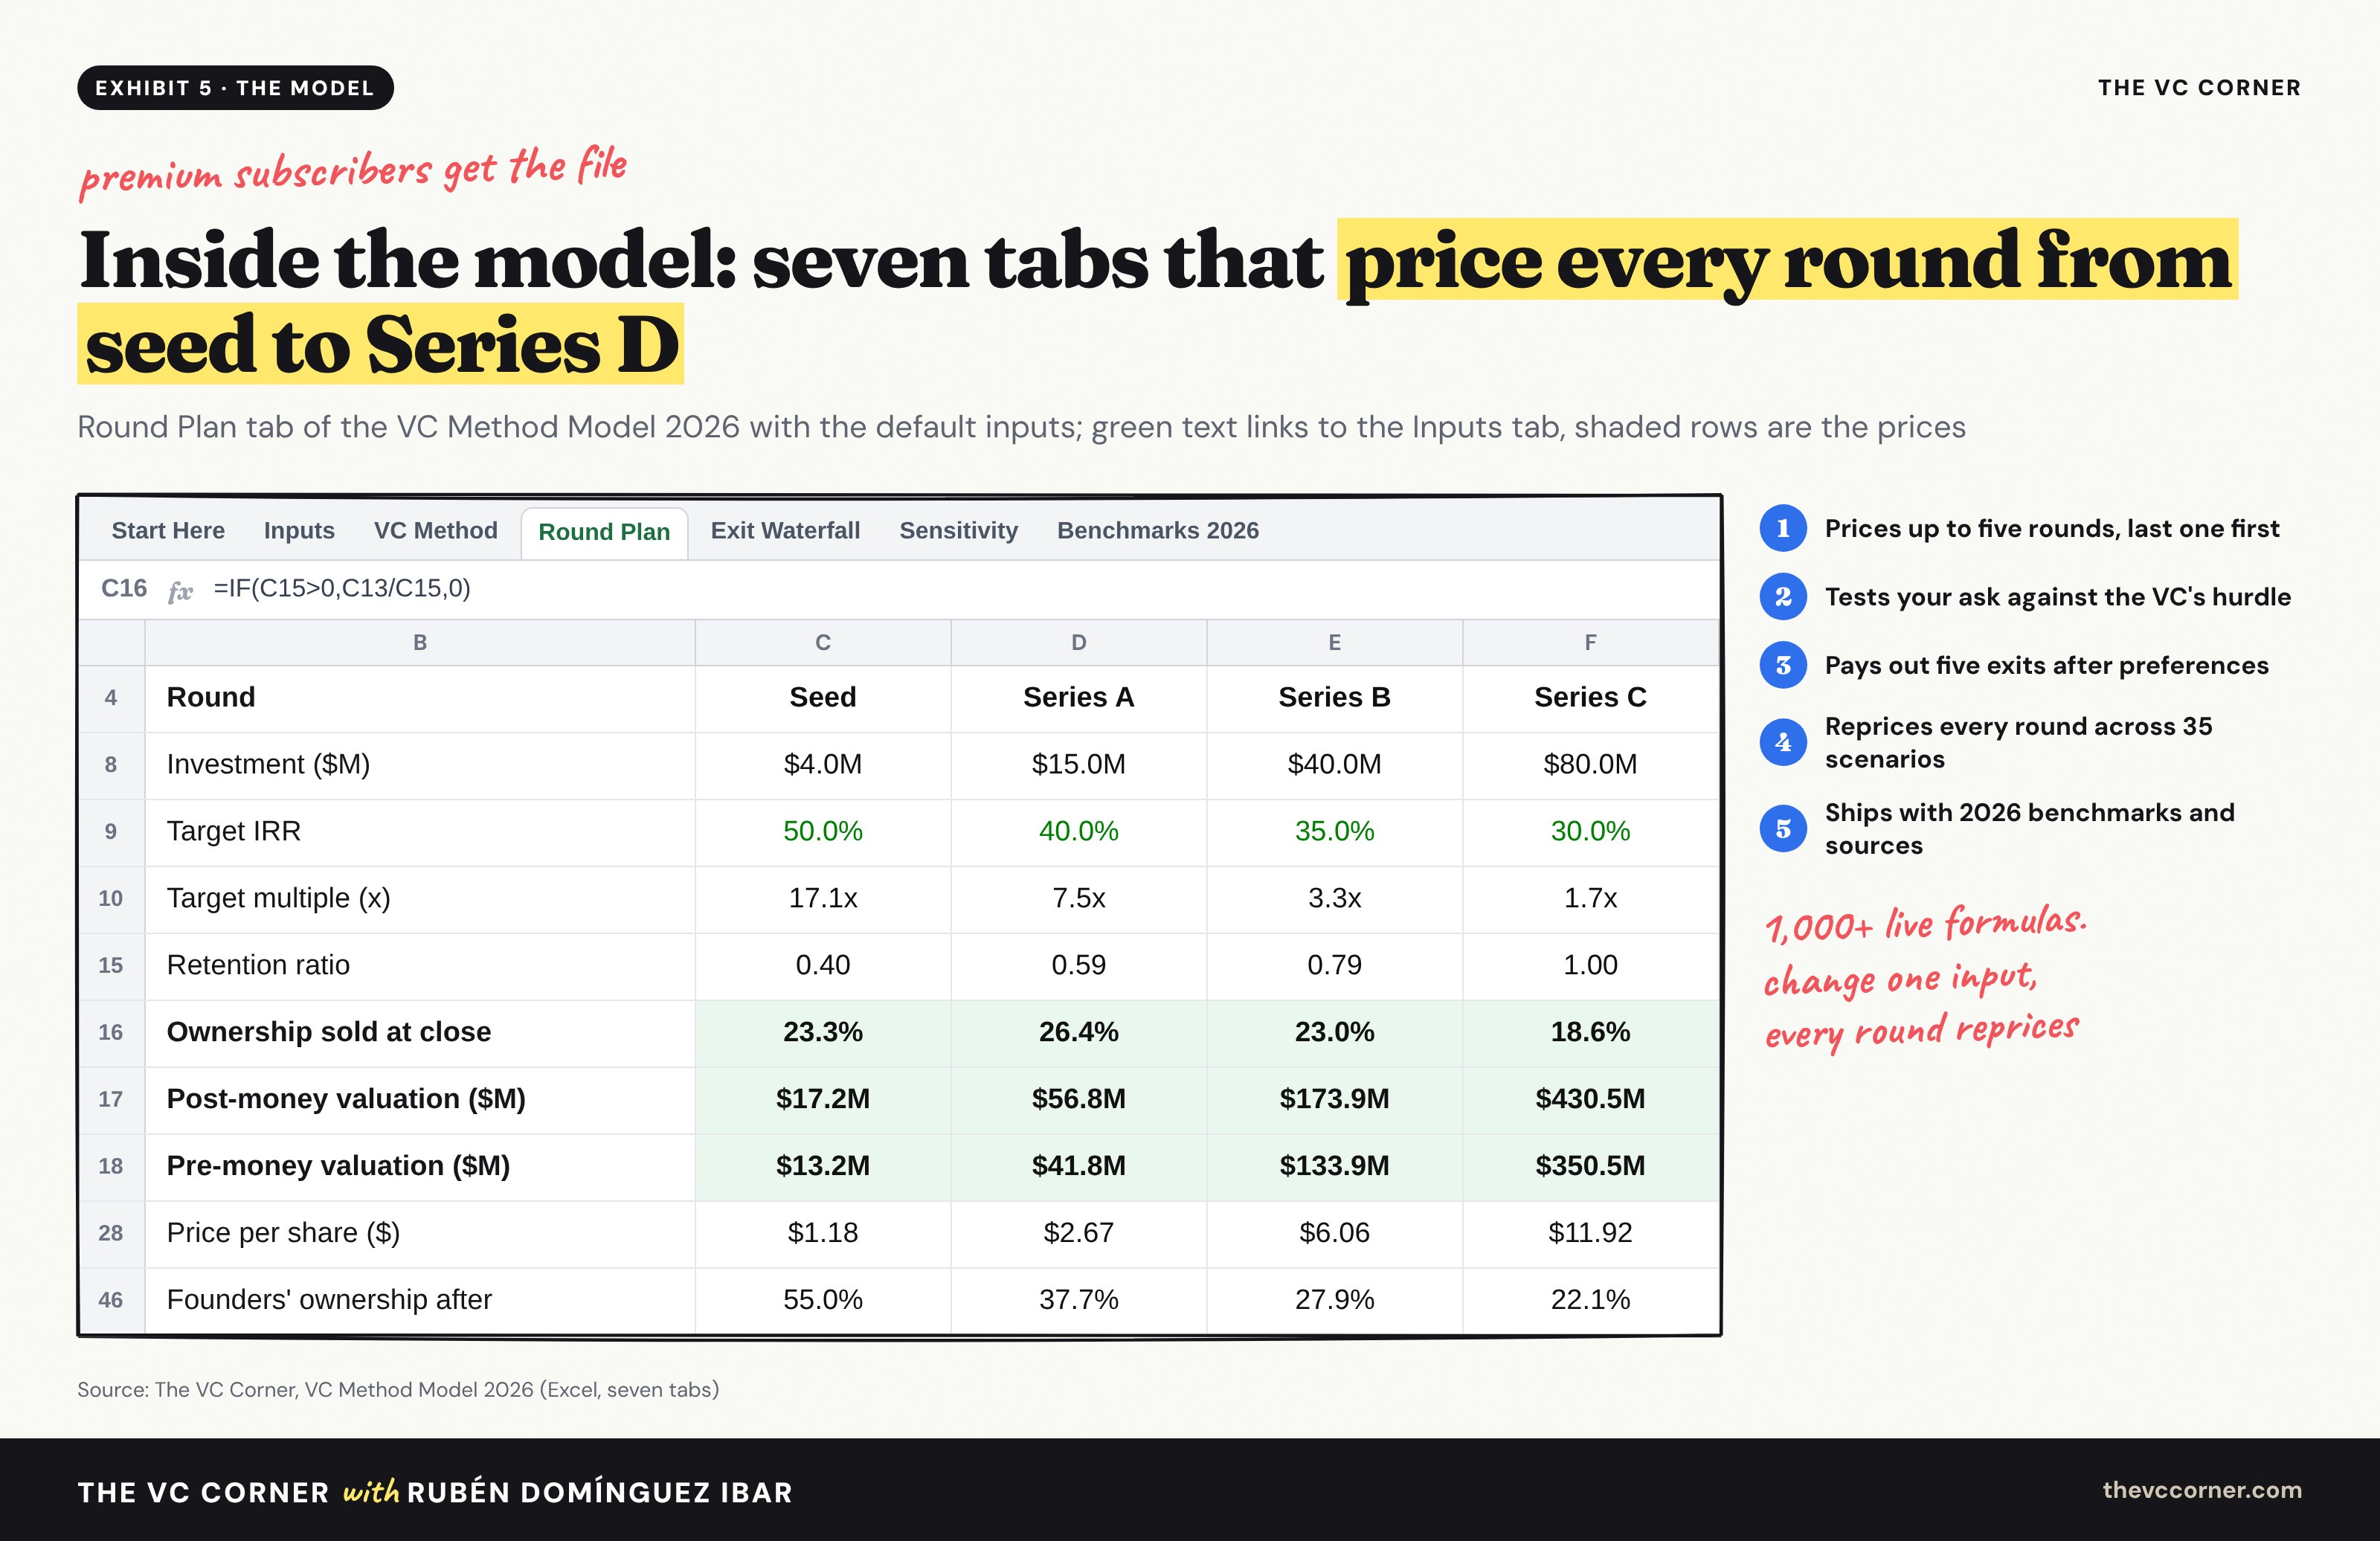
So we rewrote the guide and rebuilt the Excel model from scratch. The old file priced one round. The new one prices five, carries the dilution from every later round back into the earlier ones, tests your asking price against the investor’s hurdle and pays out the exit after liquidation preferences.
The first thing it showed us on a plain seed-stage company surprised me: the textbook one-line VC Method formula overprices the seed round 2.9x. It says $38.6M pre-money. Once you account for the Series A, B and C that follow, the number is $13.2M.
This guide walks through how investors run the method, the 2026 numbers to plug into it and where founders get burned. Premium subscribers get the model at the end.
How the VC Method works
The VC Method prices a startup backward from its exit. Bill Sahlman and Daniel Scherlis wrote it up at Harvard Business School in 1987 (note 9-288-006), and it’s still the fastest way to see a round through an investor’s eyes. A discounted cash flow model needs years of positive cash flow before it says anything useful, while the VC Method needs four numbers: the exit value, the year it happens, the check and the return the investor wants.
Take the default company in our model. It has $1.5M of ARR today and grows to $72.7M by 2033, so at 10x revenue it exits for $727M. It’s raising a $4M seed from a fund that wants 50% a year.
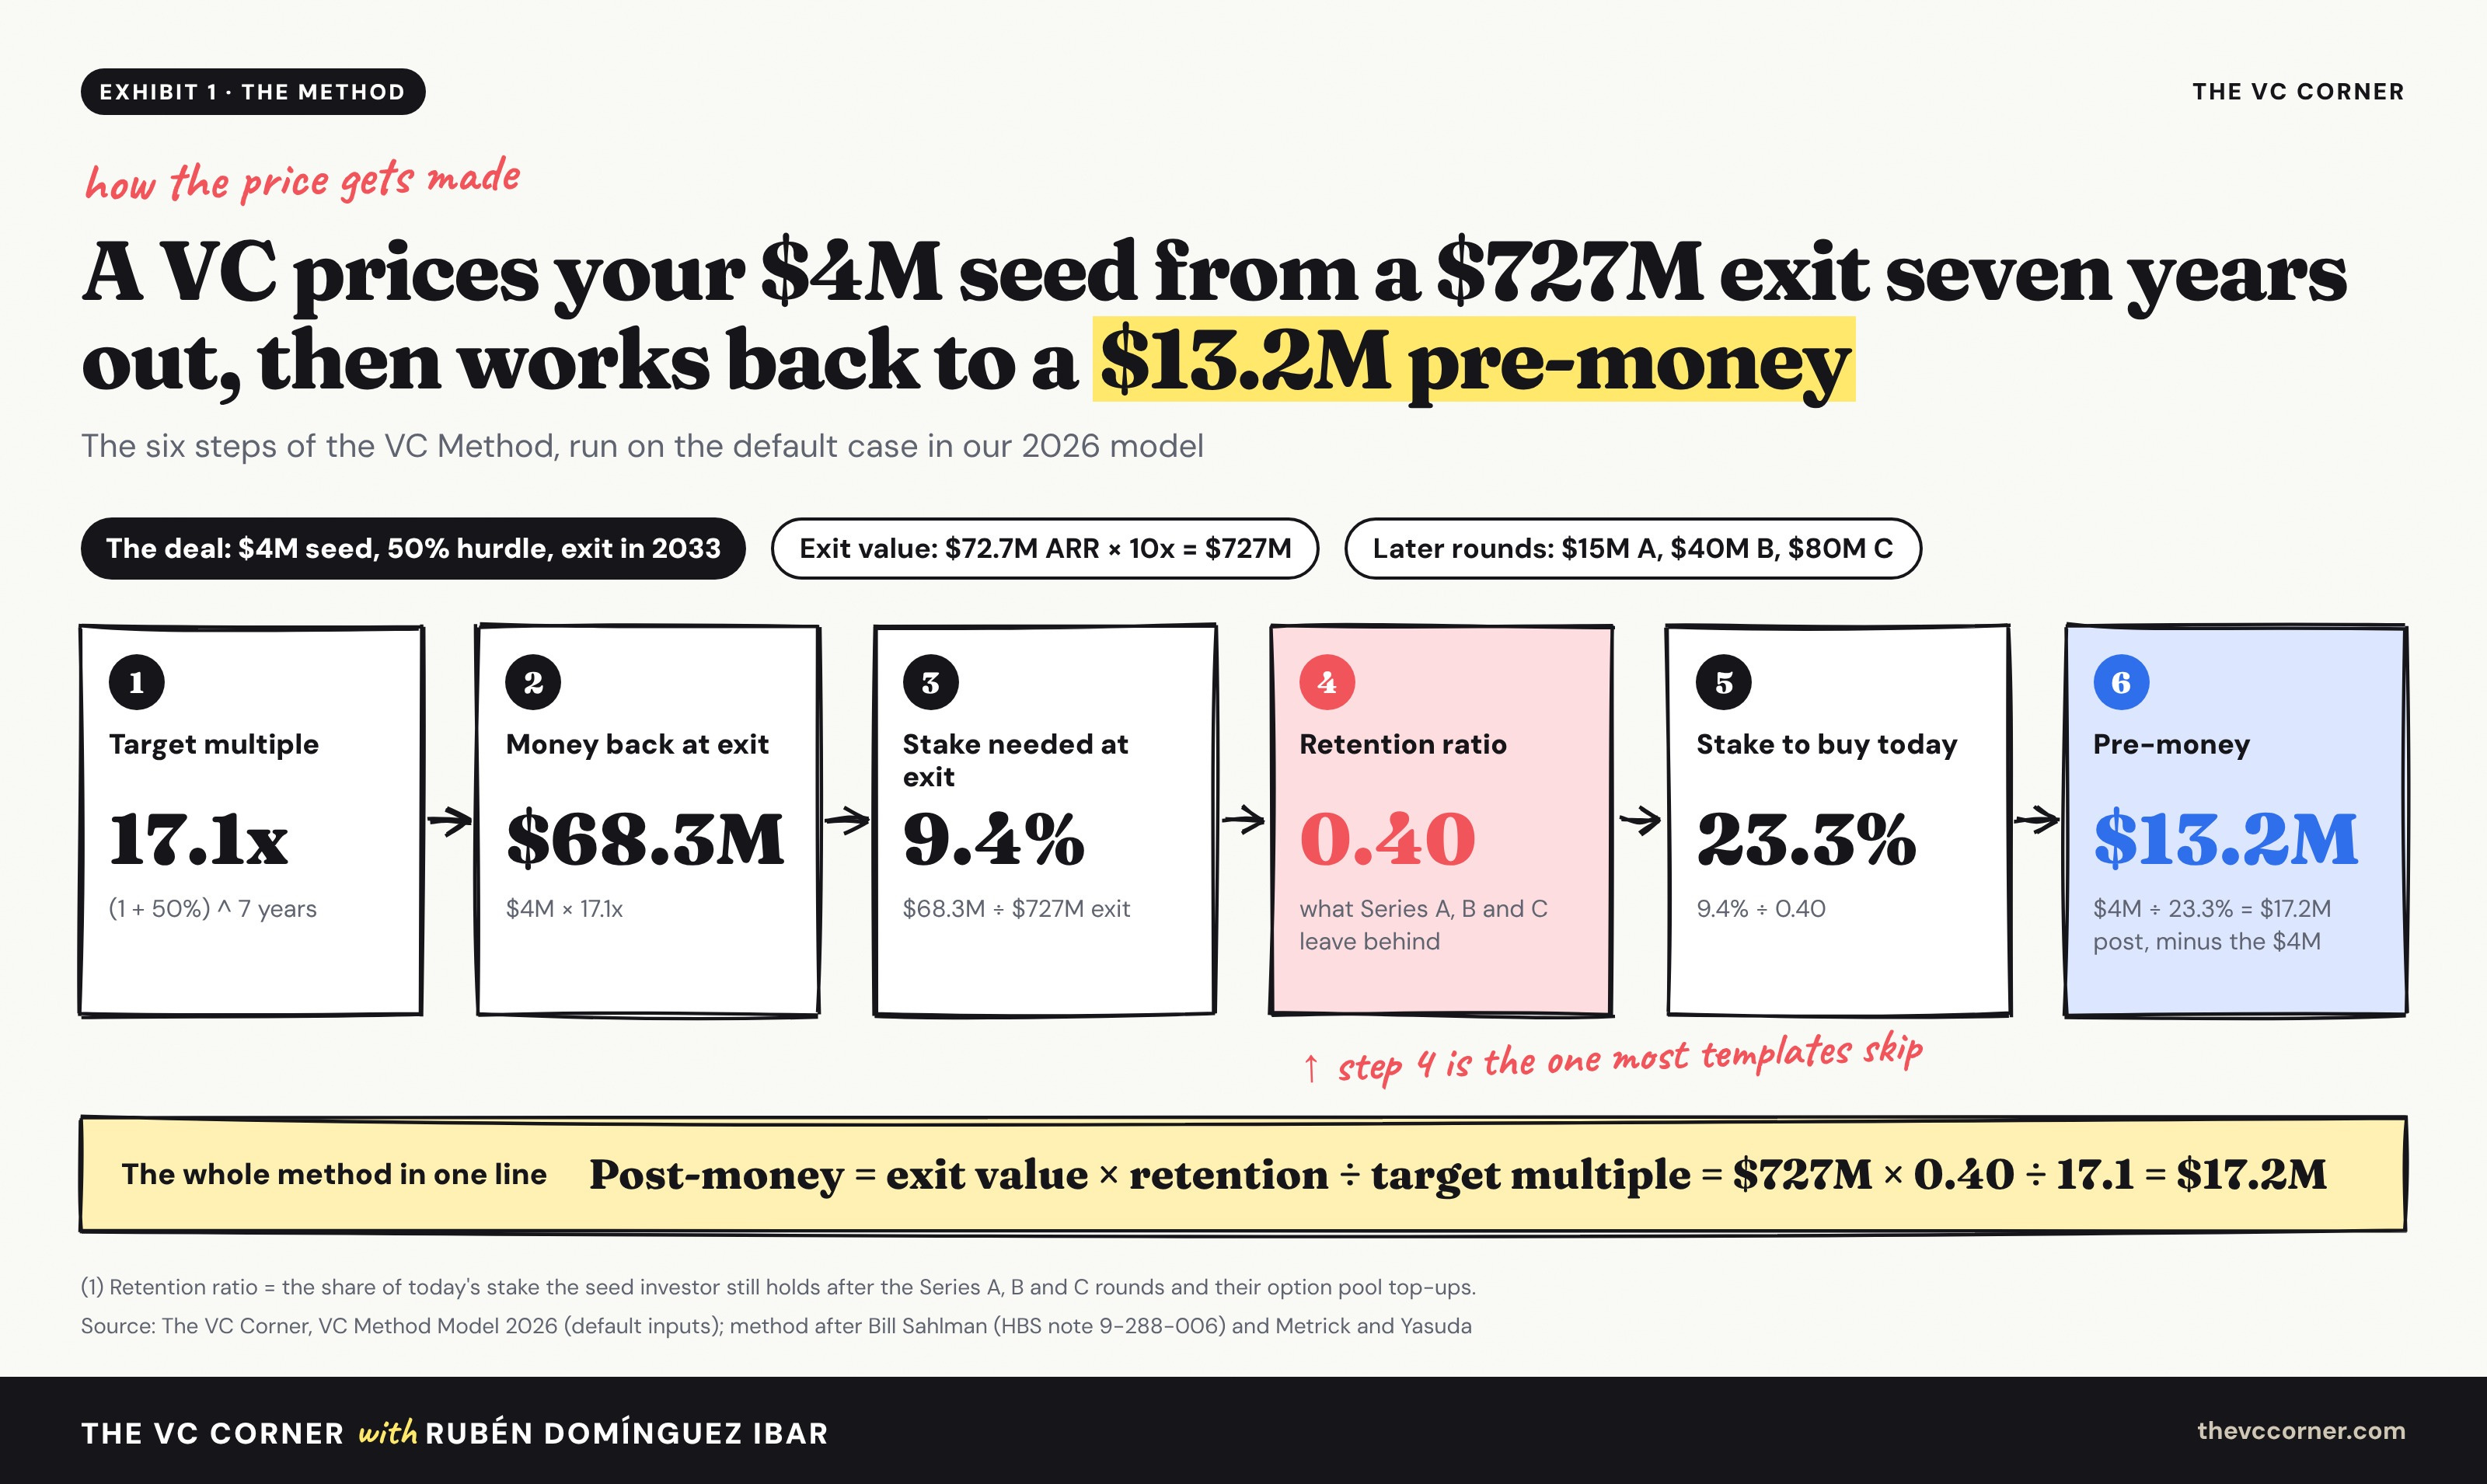
The investor runs six steps:
Target multiple. 50% a year for seven years compounds to 17.1x.
Money back at exit. $4M times 17.1x is $68.3M.
Stake needed at exit. $68.3M out of a $727M company is 9.4%.
Retention ratio. The Series A, B and C will dilute that stake, so the investor estimates how much of it survives. Here the answer is 0.40, meaning 40 cents of every dollar of ownership bought today is still there in 2033.
Stake to buy today. 9.4% divided by 0.40 is 23.3%.
Price. $4M for 23.3% means a $17.2M post-money, which is a $13.2M pre-money.
Collapse the six steps and you get one line: post-money equals exit value times the retention ratio, divided by the target multiple. Here that’s $727M × 0.40 ÷ 17.1 = $17.2M.
The hurdle rate
A 50% hurdle looks greedy until you see what it pays for. Damodaran’s slides on valuing and pricing young and start-up firms list typical target rates of return by stage: 50% to 70% for start-ups, 40% to 60% at the first stage, 35% to 50% at the second and 25% to 35% for a bridge to an IPO.
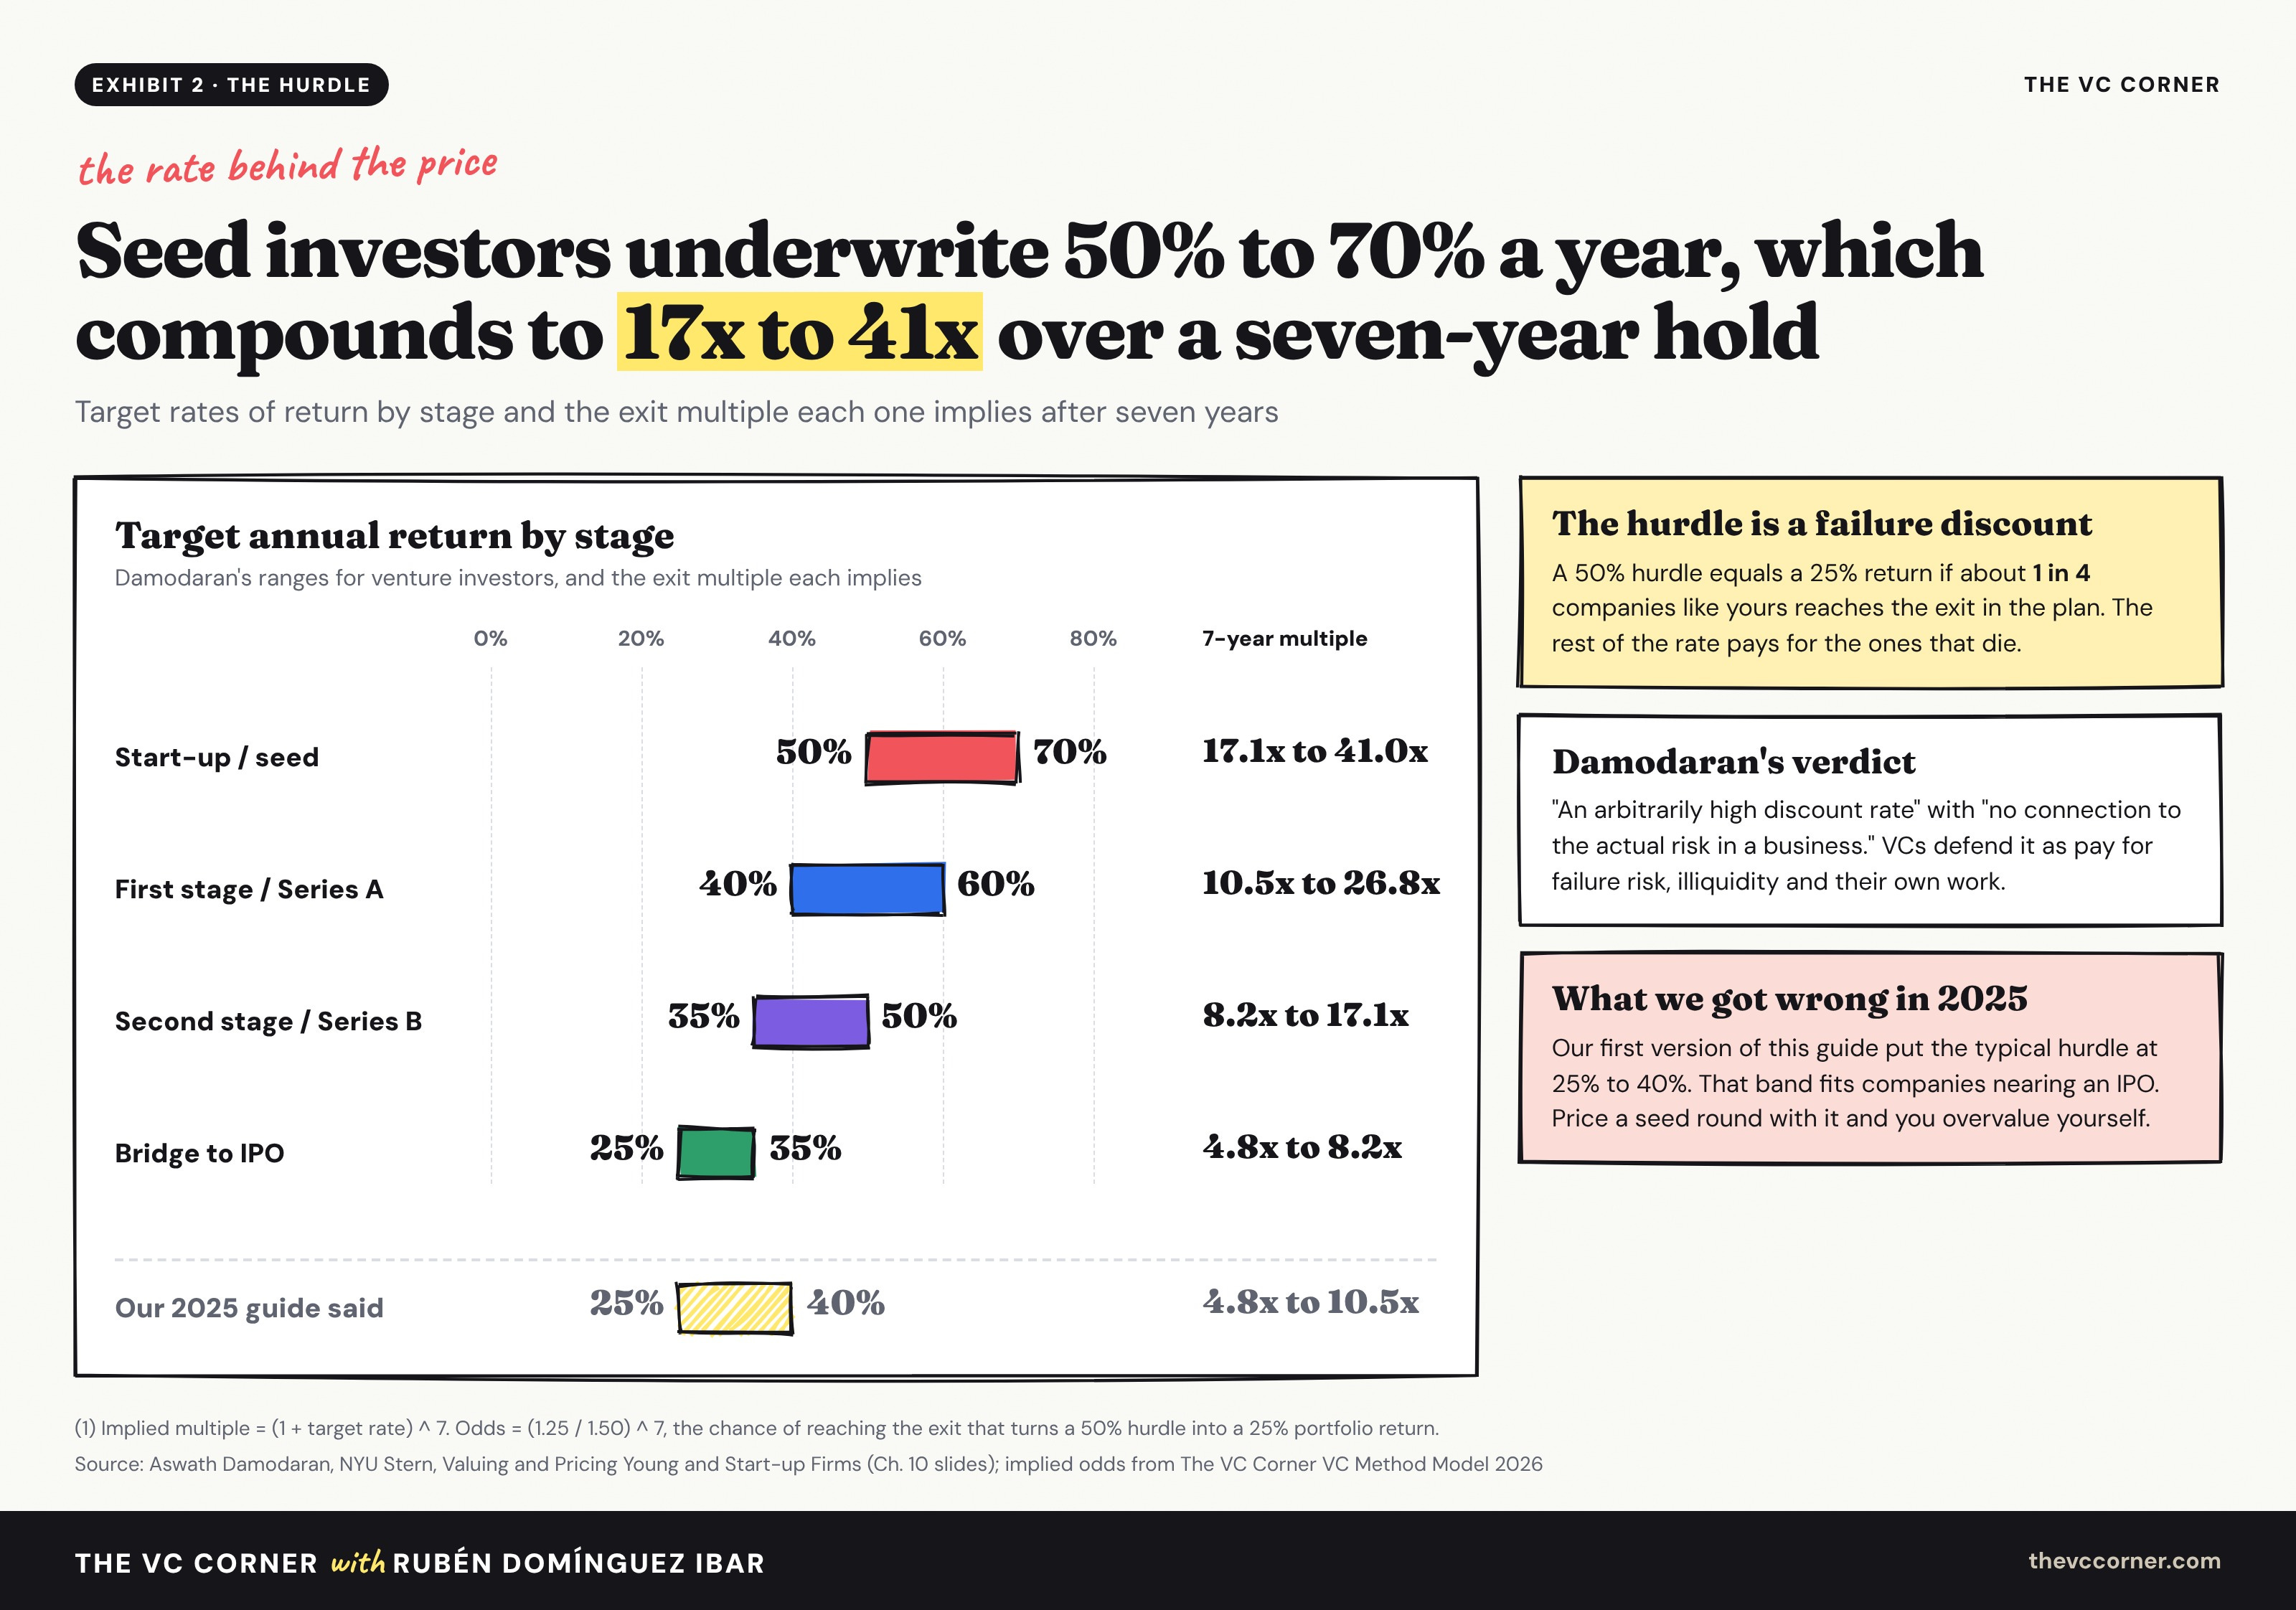
He describes the result as closer to forward pricing than to valuation, with the exit value discounted “at an arbitrarily high discount rate with no connection to the actual risk in a business.”
The useful way to read the hurdle is as a failure discount. Say the fund needs 25% a year across its whole portfolio. A 50% hurdle on your deal then implies about a 28% chance that you reach the exit in your plan, a bit better than one in four. The rest of the rate pays for the companies that die before 2033.
→ What it means for your price: at a 50% hurdle, every year you add before the exit cuts the post-money by a third, all else equal. Shave a year off a credible path to exit and the post-money rises 50%, all else equal.
Dilution and the retention ratio
Step 4 is the one the textbook version leaves out. That version divides the exit by the target multiple and stops: $727M ÷ 17.1 is a $42.6M post-money and a $38.6M pre-money. It assumes the seed investor still owns its 23.3% in 2033, when it will own 9.4%.
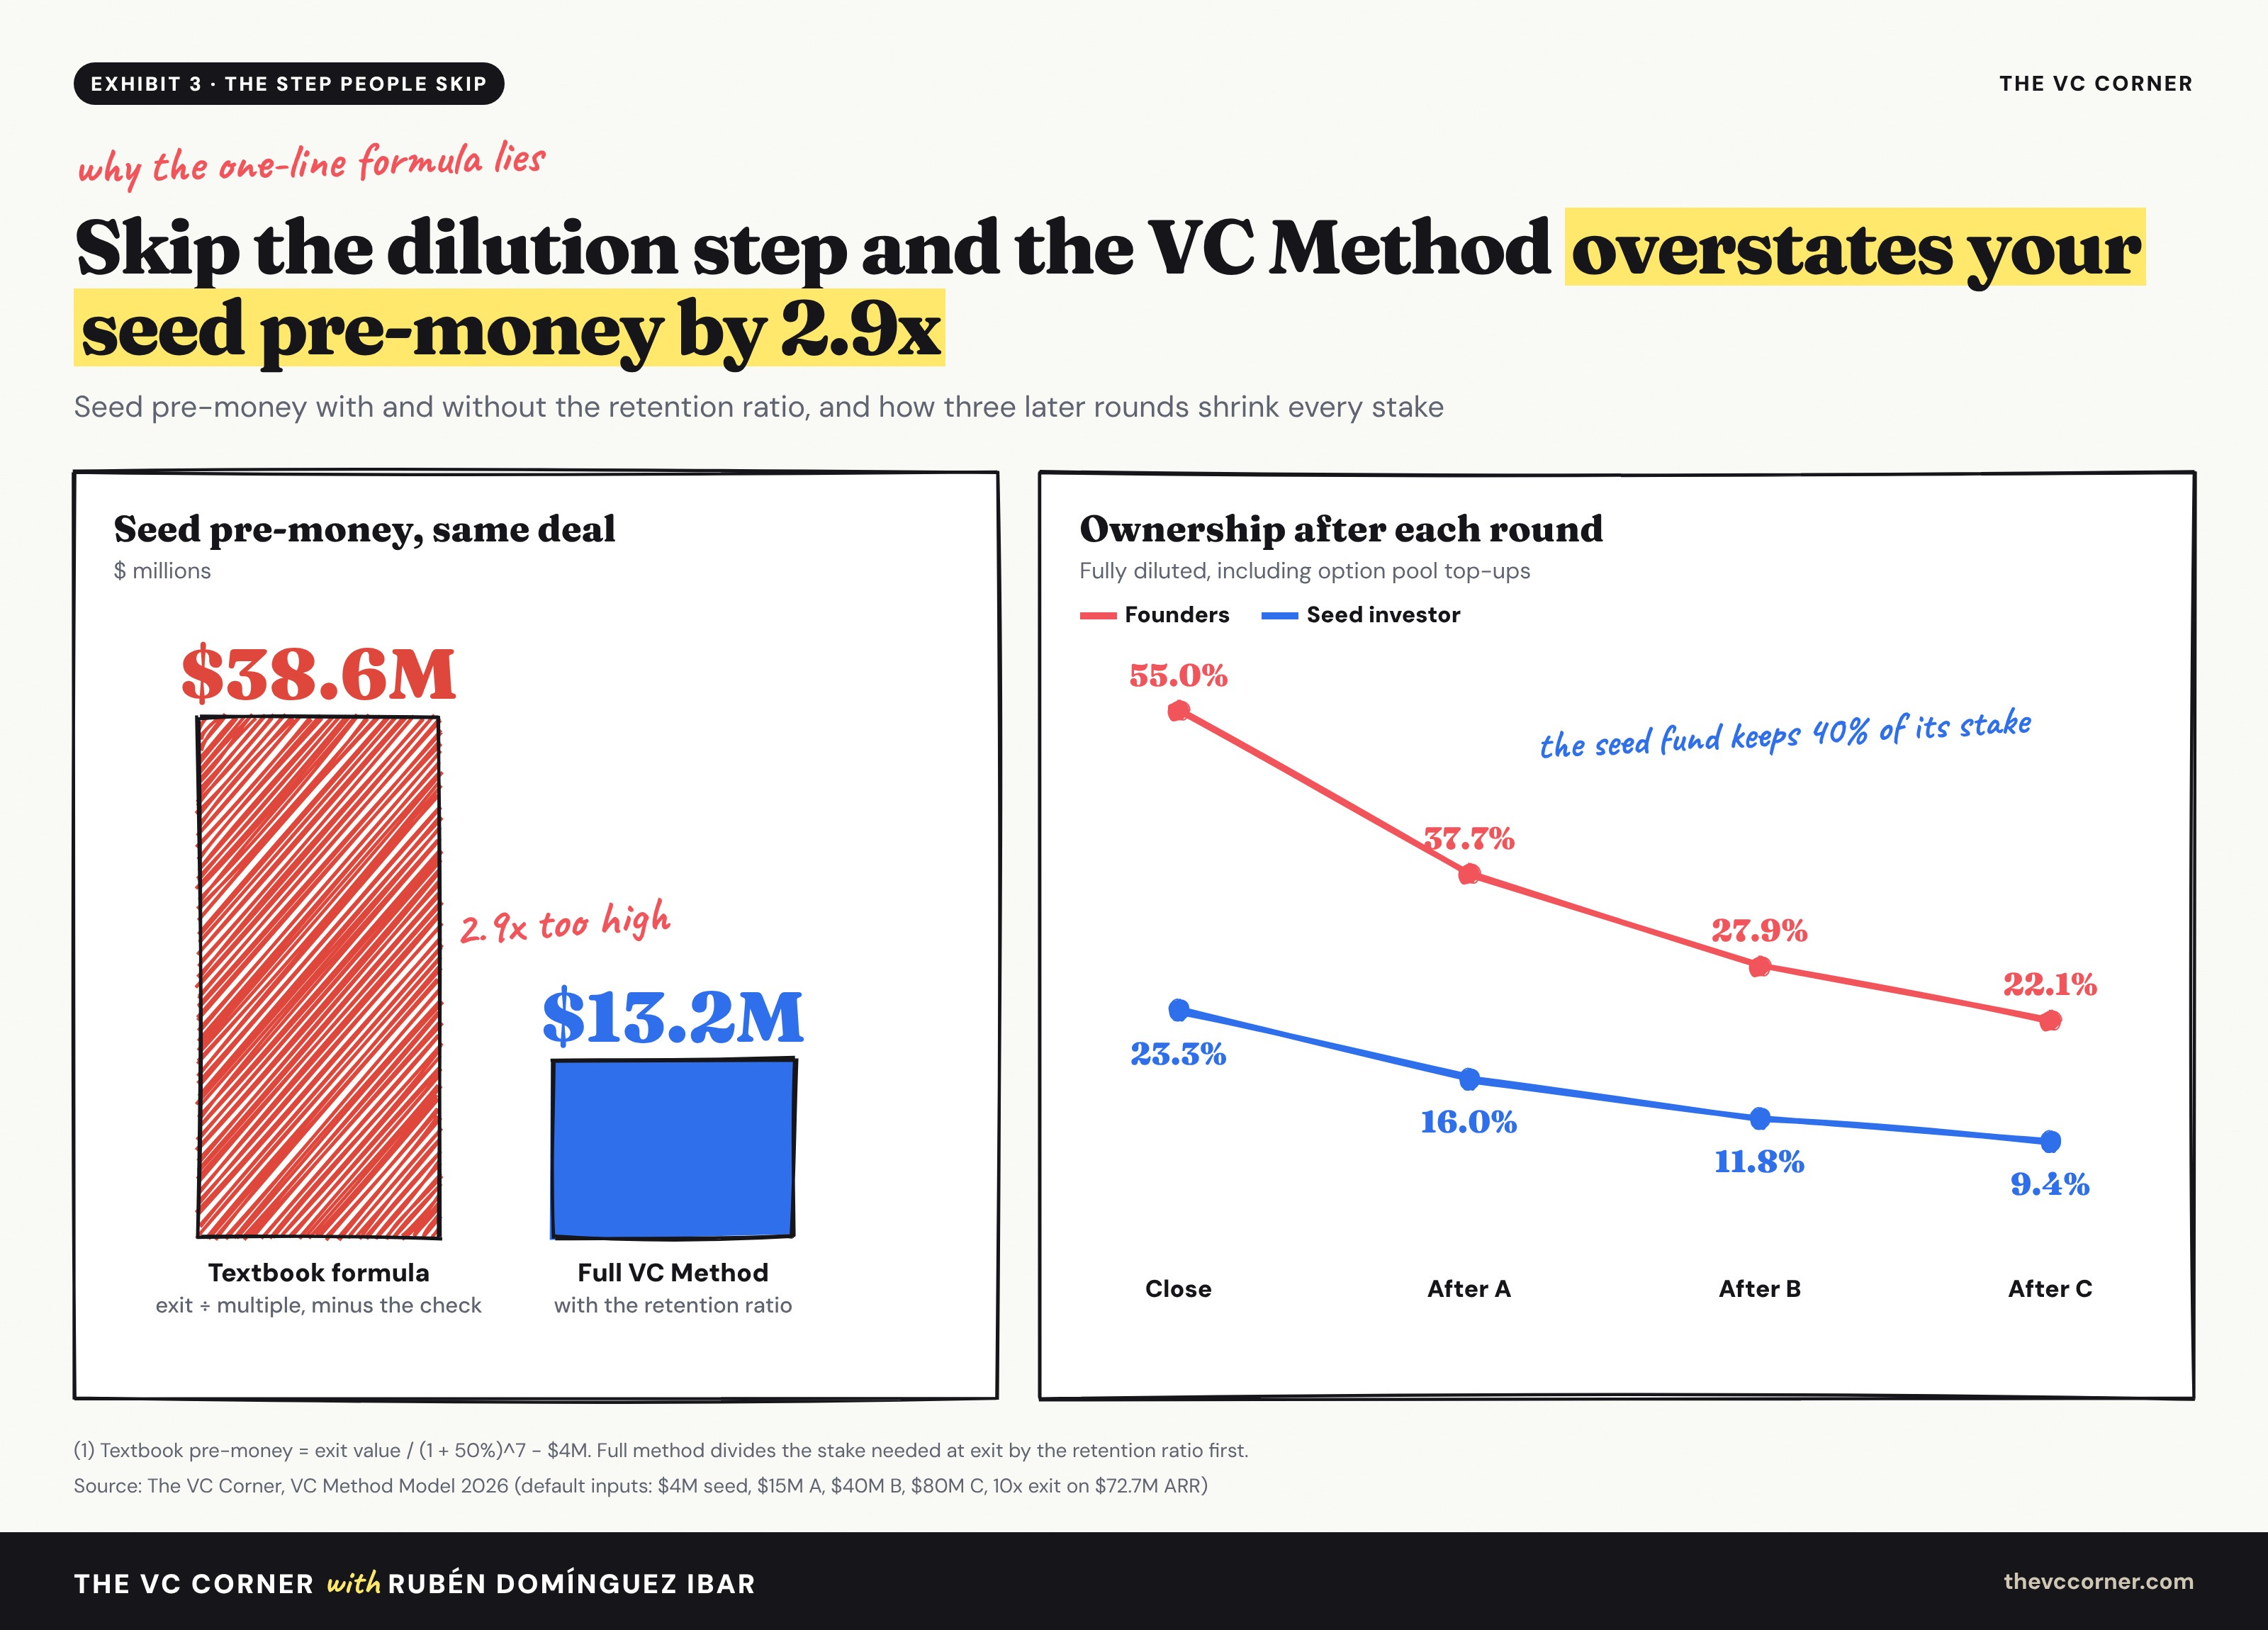
Three later rounds do the shrinking. In the default plan the Series A sells 26.4% of the company, the B sells 23.0% and the C sells 18.6%, and each round tops up the option pool on the way. Founders go from 80% before the seed to 55.0% after it and 22.1% after the Series C.
Carta’s medians for US software dilute less per round. Peter Walker’s December 2025 data shows 19.5% at seed, 18% at Series A, 14% at B, 10% at C and 7.5% at D. Compound those and a founder keeps 47.3% of their pre-seed stake through a Series D, before any pool top-ups.
The retention ratio is the number that separates a fundable seed price from a fantasy one. A founder who walks in quoting the textbook number is anchored 2.9x above anything the investor’s own model will pay.
The 2026 inputs
The price is only as good as the four inputs behind it. Here is where each one sits in late 2026.
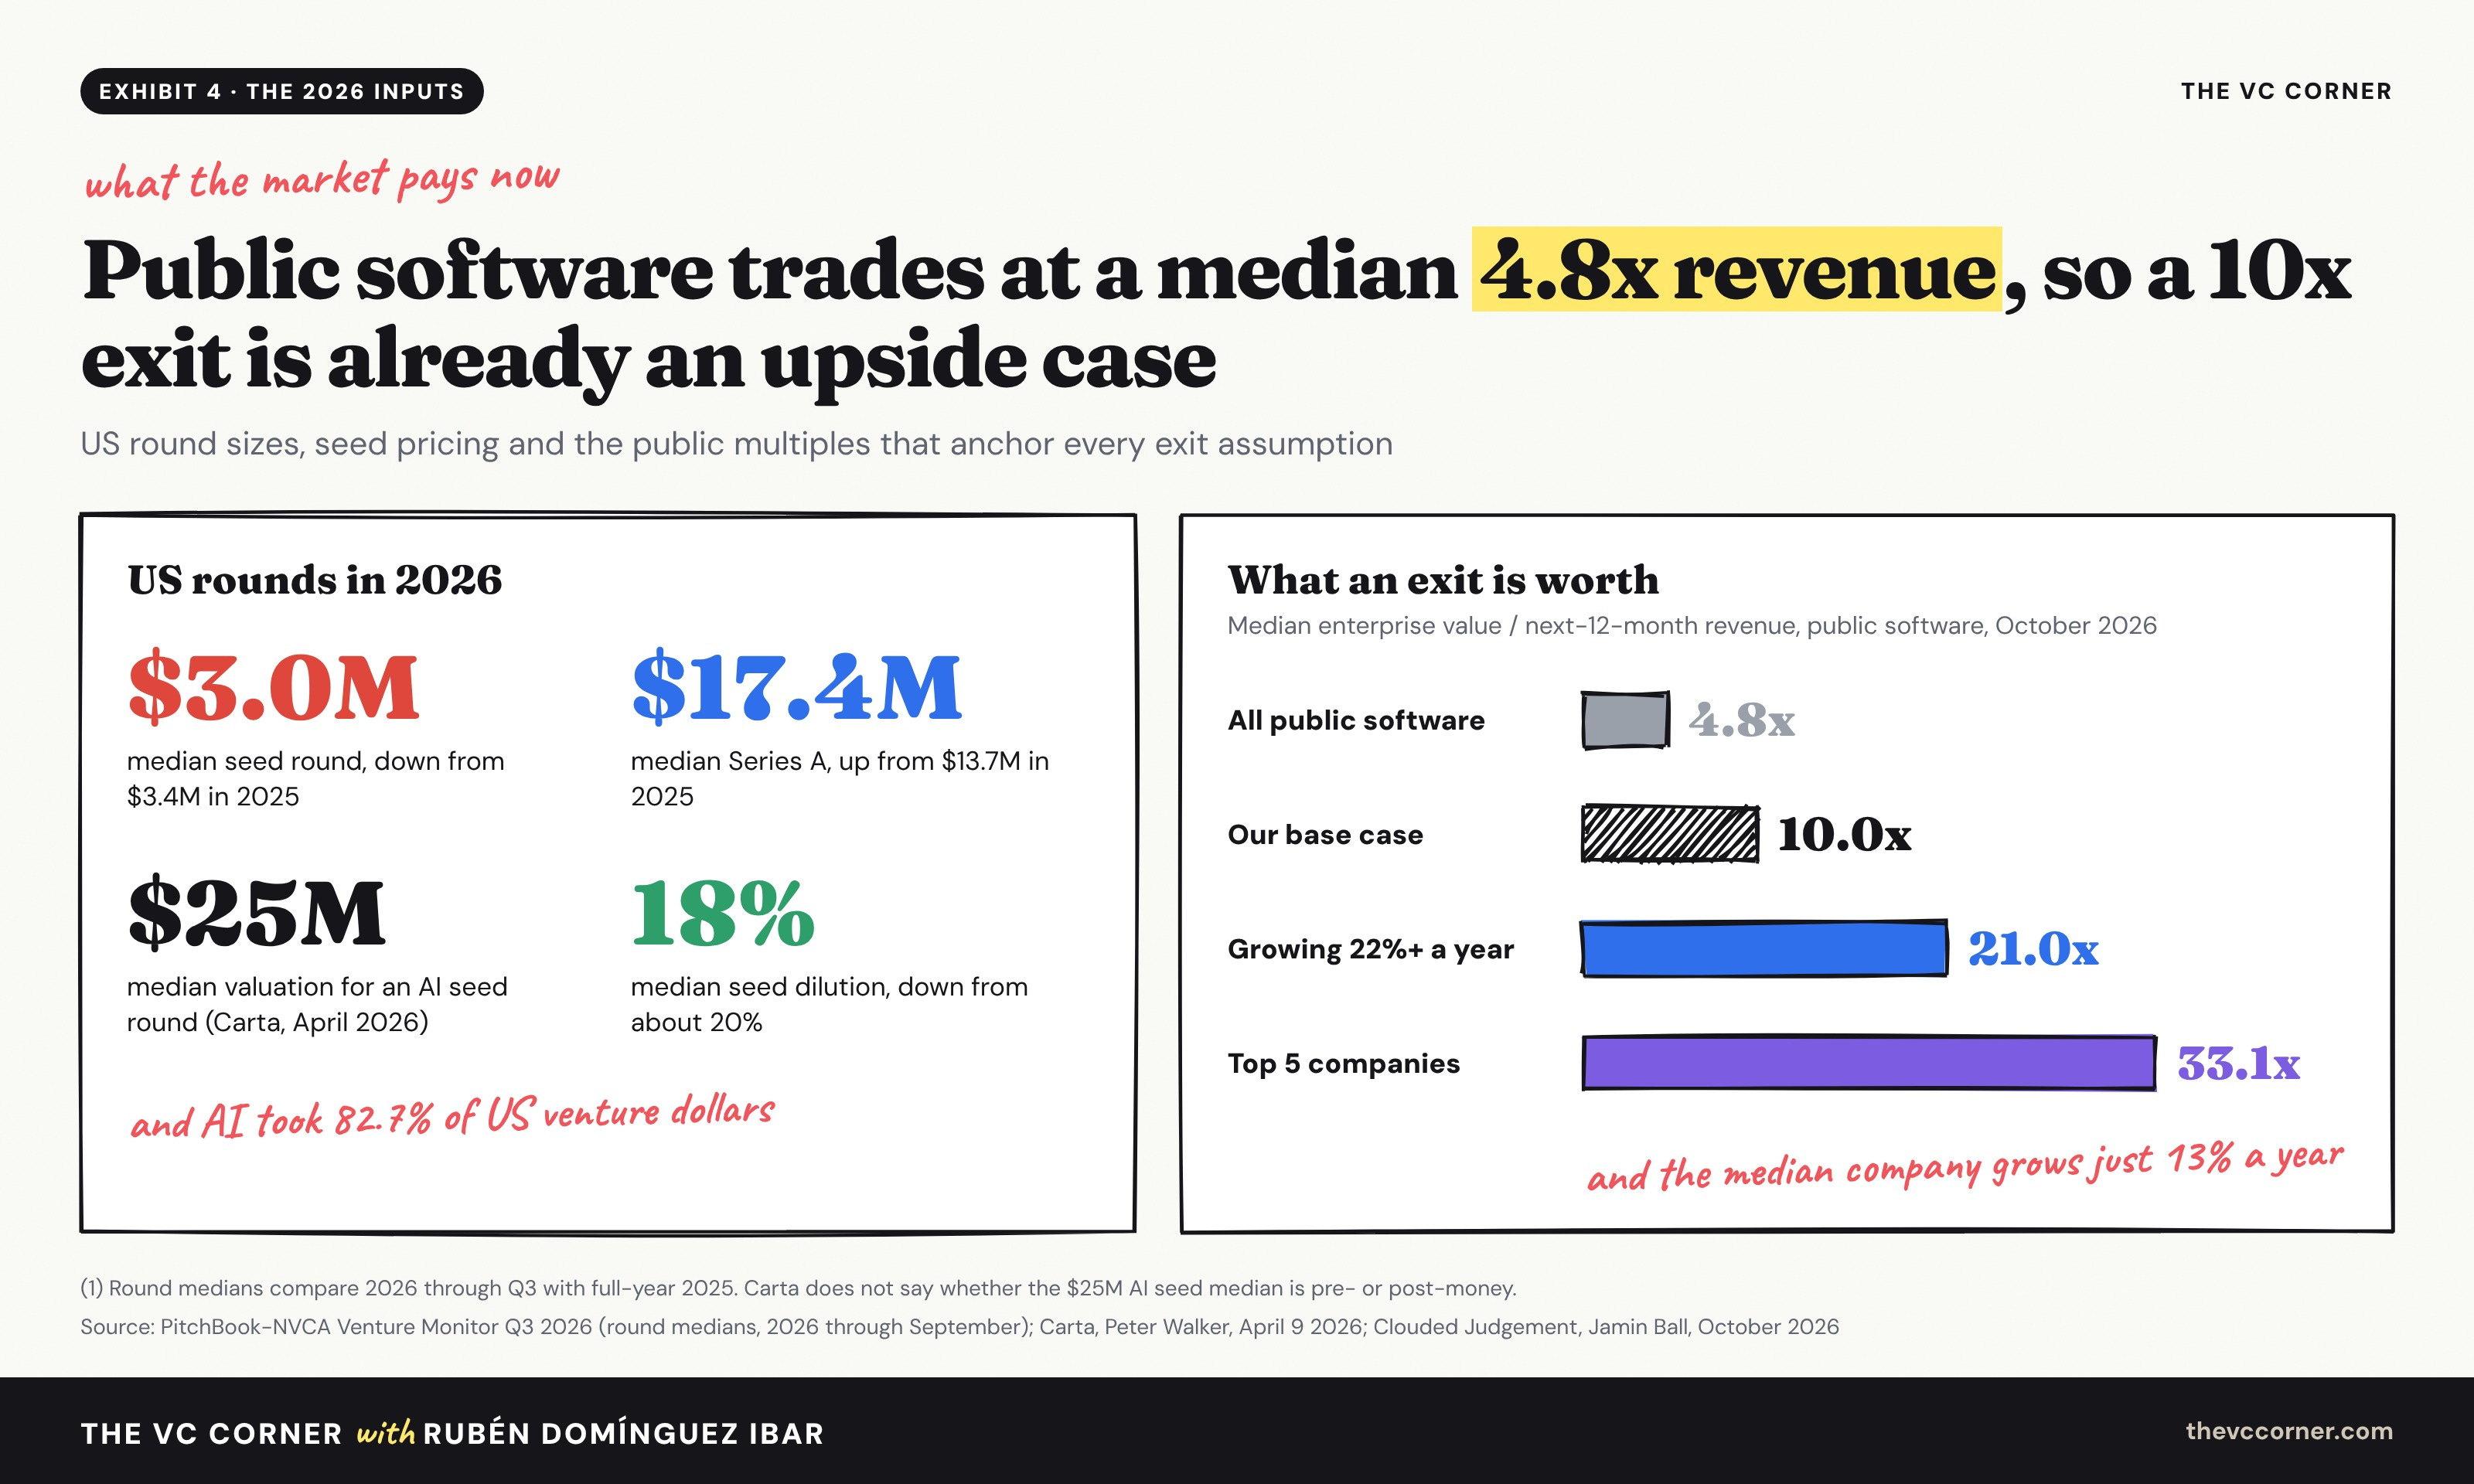
→ Round sizes. The median US seed deal fell to $3.0M in the first nine months of 2026, down from $3.4M in 2025, while the median Series A grew to $17.4M from $13.7M, according to the PitchBook-NVCA Venture Monitor for Q3 2026 (via Scalable). AI companies took 82.7% of the dollars.
→ Seed prices. Carta’s Peter Walker put the median AI seed valuation at $25M in April 2026, with median seed dilution at 18%, down from about 20%. At pre-seed, 93% of rounds in Q2 2026 were SAFEs, and SAFEs of $2.5M or more carried a $35M median valuation cap (Carta).
→ Exit multiples. Jamin Ball’s Clouded Judgement for October 23, 2026 has the median public software company at 4.8x next-twelve-month revenue, growing 13% a year. Companies growing faster than 22% trade at a 21.0x median, and the top five at 33.1x.
The exit multiple is the input founders stretch most. A 10x multiple in 2033 sounds modest until you remember that the median public software company trades at less than half of it today, so 10x already assumes you’ll still be one of the fast growers at exit.
The claim I doubt most
I doubt many seed investors open a spreadsheet like this before they send a term sheet. Seed prices in 2026 come from competition, and an AI company with three term sheets gets the $25M median or more, whatever a model says.
So why run it? Because the investor runs the reverse version in their head. At your ask, they back out the exit they’d have to believe in. For our default company, a $25M pre-money needs a $1.23B exit to hit a 50% hurdle, which is 1.7x the plan. If your deck can defend a $1.2B outcome, ask for $25M. If it defends $727M, the math lands at $13M, and you should know that before the partner meeting.
What’s in the model
The free half of this guide gives you the method. The model gives you your numbers: the pre-money an investor can pay for your round, the exit you have to defend at your ask, and the cash you take home if the company sells for $100M after you’ve raised the whole plan. On our default cap table, that last number is $0, and the model shows you exactly why.
We built The VC Method Model 2026 from scratch for this edition. Here’s what premium subscribers get below the line:
Round Plan: prices up to five rounds, seed to Series D, from the last round back to today, with the retention ratio, price per share and a full cap table after every round
VC Method: the six steps for the round you’re raising, plus a test of your ask that returns the investor’s IRR, the gap to their hurdle and the exit you must defend
Exit Waterfall: what founders, employees, angels and every preferred series take home at five exit values, with 1x non-participating preferences applied
Sensitivity: 35 scenarios that reprice every round across exit multiples and hurdle rates, plus your ownership and your proceeds on the same grid
Benchmarks 2026: Damodaran’s hurdle ranges, Carta’s dilution medians, PitchBook-NVCA round sizes and public software multiples, each linked to its source
Three negotiation talk tracks for when your ask sits above the investor’s math, with the numbers to back each one
Premium also gets you every model in our financial models library, 10,000+ investors in our investor lists and the decks in our pitch deck library. More than 142,000 founders, operators and investors subscribe to The VC Corner.
Cancel anytime. First subscribers get 50% off forever.
Here’s The VC Method Model 2026. Download it and open it in Excel or Google Sheets. Blue cells are inputs, yellow ones move the answer most, and everything else is a formula: