
CLTV vs CAC Ratio: The One Metric That Can Make or Break Your Startup (+ Excel Model)
A complete and practical guide to mastering your CLTV to CAC ratio with real examples and a free financial model for founders, marketers, and finance teams

If you’re building a startup, one question matters more than most:
How much does it cost to get a customer, and how much are they worth?
That’s what the CLTV to CAC ratio tells you. It's not just another metric. It's how you know whether your growth is efficient, scalable, and worth backing.
This guide is for founders, marketers, and operators who want real clarity. You’ll learn how to calculate CAC and CLTV properly, without vague shortcuts or bad assumptions.
We’ll go through real examples using a financial model designed for early-stage teams. You’ll also get an Excel template to track your own numbers, identify red flags early, and make smarter decisions.

Table of Contents
1. What Is CAC (Customer Acquisition Cost)?
2. What Is CLTV (Customer Lifetime Value)?
3. The CLTV to CAC Ratio And Why It Matters
4. What Is the CLTV vs CAC Ratio Analysis Model?
5. Why This Model Matters
6. What’s Inside the Model (Tabs & KPIs)
7. How to Use the Model in 3 Simple Steps
8. Who Should Use This and When
9. Download the CLTV vs CAC Excel Template
1. What Is CAC (Customer Acquisition Cost)?
Before you can optimize your CLTV to CAC ratio, you need to calculate CAC the right way, and most founders get it wrong.
Customer Acquisition Cost (CAC) is the total cost of acquiring a single paying customer. It’s a core part of your SaaS unit economics and one of the most scrutinized startup growth metrics by investors, CFOs, and GTM teams alike.
The CAC Formula
At its simplest, CAC is calculated like this:
CAC = (Sales + Marketing Spend) / New Customers Acquired
Let’s say your startup spent $25,000 on sales and marketing last month, and you brought in 500 new customers. Then your CAC would be $50.
 formula example")
But if it looks so easy, why do most founders still get it wrong?
Most Founders Underestimate CAC
Too often, early-stage teams calculate CAC using just ad spend or media buying costs. That leaves out the full picture. A true CAC calculation should include:
Paid media (ads, influencers, sponsorships)
Content production and SEO
Marketing tools and CRM platforms
Sales team salaries and commissions
Outsourced agencies or consultants
Any other spend tied directly to acquiring customers
If you're running a Product-Led-Growth (PLG) motion, even onboarding tools and support may belong in the equation.
The more accurate your CAC, the more meaningful your CLTV to CAC ratio becomes.
Track CAC Monthly, and by Channel
CAC isn’t a “once-a-quarter” metric. You should be tracking it monthly, ideally with granularity by acquisition channel (e.g. Google Ads, referrals, outbound sales, content). That’s how you spot trends early and proactively.
Flags like rising ad costs, decaying conversion rates, or channels that quietly stop performing are caught by a monthly tracking of the CAC ratio.
The best financial model for CAC lets you see how your cost per customer fluctuates over time, and how it impacts the efficiency of your growth engine.
2. What Is CLTV (Customer Lifetime Value)?
If CAC tells you what it costs to get a customer, Customer Lifetime Value (CLTV) tells you how much that customer is worth to your business over time. It’s essentially the other half of the CLTV to CAC ratio, and where your real margin lives.
Start with the Basic CLTV Formula
The simplest way to calculate CLTV is:
CLTV = (Average Purchase Value × Purchase Frequency) × Average Customer Lifespan
For a SaaS company, this often turns into:
CLTV = ARPU / Customer Churn Rate
It’s a solid starting point, but it only shows revenue, not profit. And that’s a problem.
The Formula That Actually Matters
Investors don’t care how much money you make, they care how much you keep. That’s why serious operators use a gross-margin-adjusted version:
CLTV = (ARPU × Gross Margin) / Churn Rate
This gives you a clearer view of your true earnings per customer. If your average revenue per user is $100/month, churn is 5%, and your gross margin is 80%, then:
CLTV = ($100 × 0.8) / 0.05 = $1,600
That’s how much gross profit one customer brings in over their lifetime. This is the number you should be using in your financial model CLTV CAC template, instead of just raw revenue.
 formula calculation")
What Makes CLTV Go Up?
CLTV doesn’t appear out of nowhere. It gets built through smart decisions across product, retention, and pricing. The biggest levers are:
Retention: The longer they stay, the more they’re worth
Upsells and expansions: More products, higher tiers, added features
Subscription mechanics: Predictable revenue and lower churn
Usage and stickiness: The more value customers get, the longer they stay
If you want a better CLTV to CAC ratio, you can either lower CAC, or grow CLTV by building something customers stick with, spend more on, and stay loyal to.

3. The CLTV to CAC Ratio And Why It Matters
Once you’ve nailed down your Customer Lifetime Value (CLTV) and Customer Acquisition Cost (CAC), you need to answer the most important question in business:
Are your customers actually profitable?
That’s what the CLTV to CAC ratio tells you. It reflects how efficiently your business turns marketing and sales spend into long-term value. And all you have to do is divide the two metrics:
CLTV to CAC Ratio = CLTV / CAC
The key lies in being able to interpret what the ratio means for your business. Here’s a simple way of reading it:
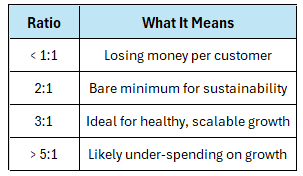
< 1:1 - You're Paying More Than You Earn
If your CLTV to CAC ratio is less than 1, you’re spending more to acquire customers than they’ll ever bring in. This usually points to either unsustainably high CAC or poor retention driving low CLTV.
It’s a common trap for early-stage startups with high burn and leaky funnels such as big paid campaigns and short customer lifespans.
This ratio means that your model is burning cash without building value. Urgent fix is required.

2:1 - Barely Sustainable
A 2:1 ratio means you're getting $2 back for every $1 you spend to acquire a customer. Technically, you’re not losing money, but you are not safe either.
This level might be tolerable in the short term if you’re optimizing or ramping new channels, but it's not where you want to stay.
An eCommerce brand with a $50 CAC and $100 CLTV will probably be okay. But the moment ad costs rise or repeat purchases dip, things could get ugly.
3:1 - The Sweet Spot
This is the benchmark most VCs and CFOs look for. A CLTV to CAC ratio of 3:1 means your model is working. You’re acquiring customers at a cost that’s justified by the value they bring.
It signals healthy unit economics, with enough margin to reinvest in growth while staying capital-efficient. Most SaaS companies aim for this as their baseline target.
> 5:1 - Room to Grow Faster
At first glance, a 5:1 ratio sounds amazing, and in some cases, it is. But it could also mean you’re under-spending on acquisition. If every customer brings in 5x what they cost, you may be leaving growth on the table.
Example: A B2B SaaS company with long-term contracts, low churn, and almost no paid marketing. Their CLTV to CAC ratio hits 7:1. That’s great. But if the market opportunity is big, they might want to reinvest more aggressively and move closer to 3:1 while expanding.

4. What Is the CLTV vs CAC Ratio Analysis Model?
Knowing your CLTV to CAC ratio is one thing. Tracking it month after month, and using it to make smarter decisions, is what actually moves the needle.
That’s why we built a downloadable financial model CLTV CAC template: a clean, dynamic Excel sheet that helps you track Customer Lifetime Value, Customer Acquisition Cost, and their ratio over time.
It’s designed for SaaS and eCommerce startups, growth teams, and even VC analysts who want to dig into efficiency by cohort or month.
The model isn’t just a static calculator; it’s a tool you keep updating and using at each phase of your startup’s journey.
Plug in your inputs once, and it automatically maps out your ratio as your numbers evolve.
The Input Tab
The Input Sheet is your starting line. All you have to do is fill in the grey cells:
Company Name – e.g., ABC SaaS or DTC Co.
Nature of Business – SaaS, eCommerce, services, etc.
Currency – All calculations run in your local or target currency
Start Date – When you want to begin tracking (e.g., Mar-24)

You’ll also be guided to the Model tab, where you’ll enter actual performance data such as revenue, customers, spend, and the rest updates automatically.
Once you’ve set this up, the model tracks your CAC, gross-margin-adjusted CLTV, and the CLTV to CAC ratio on a monthly basis, helping you chart how efficiently your business is growing.
5. Why This Model Matters
Most startups track Customer Lifetime Value and Customer Acquisition Cost as single averages. That’s fine for a snapshot, but it doesn’t tell a story. It doesn’t give you any insights into your business.
If your CAC is rising, if retention is slipping, or if your new go-to-market strategy is not working, you won’t catch it fast enough.
This CLTV vs CAC ratio analysis model gives you something most teams don’t have: a month-by-month, cohort-level view of your unit economics in motion.
Instead of staring at static benchmarks, you get visibility into how efficient your business is becoming, or where it’s slipping.
The Model Tab
Let’s break down what’s happening here.

CAC per user is dropping: From $178 to $89 to $32; this suggests your cost of acquiring customers is becoming more efficient, possibly due to improved targeting or organic traction.
CLTV is increasing steadily: You can see Lifetime Value jump from $644 to over $2,000 as retention improves and MRR per user climbs.
CLTV to CAC ratio improves sharply: Starting at 3.63x and climbing to over 91x. Dramatic, yes, but illustrative of how compounding efficiency plays out month after month.
This kind of monthly CLTV to CAC ratio tracking is critical for founders trying to reach sustainable growth, and equally valuable for VC analysts trying to spot investable efficiency early.
When you can visualize trends instead of relying on a single-point ratio, you make better calls on spend, hiring, pricing, and product strategy.
This model gives you that edge.
6. What’s Inside the Model (Tabs & KPIs)
This downloadable CLTV to CAC ratio analysis model isn’t just a calculator. Think of it as a dynamic dashboard for your startup growth metrics.
It helps you track what’s working, spot inefficiencies early, and model decisions with real visibility into your business dynamics.
The Graphs Tab
This is the payoff. The graphs give you a clean, visual view of what’s really happening:
The black bars represent CLTV rising month by month, showing retention and monetization gains.
The blue bars track user acquisition and CAC per user over time.
When CLTV rises faster than CAC, your CLTV to CAC ratio climbs, exactly what you want.

This second chart shows your efficiency compounding visually. When the ratio starts accelerating, it’s a signal you’re hitting product-channel fit or pricing leverage.
This is the kind of trend line that VCs use to value a startup.

Bonus KPIs to Track (or Extend)
The model includes essential metrics today, and offers room to expand further. You can track:
CAC per channel (if you break out spend by source)
MRR per customer (helps isolate monetization shifts)
Churn and retention rates monthly
Payback period (a highly requested feature, recommended for V2)
Altogether, this model doesn’t just report your CLTV to CAC ratio, it also helps you improve it.
7. How to Use the Model in 3 Simple Steps
You don’t need a finance degree or a fractional CFO to get value out of this model. Just follow these three steps, and you’ll be tracking your CLTV to CAC ratio like a professional operator.
Step 1: Input Your Business Metadata
Head to the Drivers tab and fill out the basics:
Company name
Nature of business (SaaS, eCom, etc.)
Currency
Start date for tracking
That’s it. These values set the stage for the rest of the model to run automatically.
Step 2: Enter Monthly Data
Next, go to the Model tab and update the grey cells only. You’ll plug in:
New and existing customers
Monthly recurring revenue (MRR)
Churn volume or rate
Sales and marketing spend
As soon as you fill this in, the model calculates your CAC per user, gross-margin-adjusted CLTV, and your CLTV to CAC ratio for each month.
Step 3: Review Charts and Ratios
Now head to the Graphs tab. This is where it all comes to life.
Check the visual trends in CLTV vs CAC
Watch how your ratio improves (or dips) month to month
Use the outputs to guide GTM decisions or support investor updates
We recommend updating the model monthly, or after major campaigns or pricing changes.
In general, the more consistent you are, the more powerful your insights will be.
8. Who Should Use This and When
This isn’t just a spreadsheet, it’s a decision-making tool for anyone trying to build, scale, or assess a startup with real numbers behind it.
Here’s who should be using the CLTV to CAC ratio model, and when it matters most:
SaaS Startups
If you’re still figuring out whether your growth is efficient, or if it just feels fast, this model helps you quantify the difference. By tracking monthly CLTV to CAC ratios, you’ll know exactly when you cross from traction into true viability.
eCommerce Brands
Whether you’re trying a new pricing strategy, or rolling out retention offers, this model lets you test how those moves shift your lifetime value. You’ll see quickly whether customers are sticking around long enough to justify your CAC.
Marketing Teams
If you’re running paid campaigns across multiple channels, this model helps you isolate what’s actually working. If you want to compare Google Ads vs partnerships, simply plug in segmented CAC data and measure efficiency per stream.
VCs and LPs
If you are doing diligence on a potential portfolio company, ask for this model, or plug in their data yourself. It reveals how sustainable the growth story really is, and whether the startup’s unit economics hold up across time.
Founders Raising a Round
Heading into a Series A fundraising round or prepping a data room? Investors love a clean, credible CLTV to CAC tracker, especially one that shows trends. This sheet gives you a chart-ready narrative to back your pitch and show command over your metrics.
Board Updates and Investor Reporting
If you are tired of scrambling for slides every quarter, use the Graphs tab to export visuals that make your growth efficiency instantly clear. Whether the ratio’s rising or falling, you’ll have the data and the context to explain why.
9. Download the CLTV vs CAC Excel Template
In 2025, customer acquisition costs are rising, capital is tighter, and investors are laser-focused on unit economics. If you can’t show that your business turns spend into value, efficiently and consistently, you’ll lose ground.
That’s why this model matters.
It gives you a dynamic, month-by-month view of your CLTV to CAC ratio. You’ll be able to:
Track CAC per user and gross-margin-adjusted CLTV
Visualize your ratio trends over time
Diagnose when you’ve hit efficient growth, or where it’s breaking
Prepare for fundraising, hiring, board meetings, and GTM decisions with confidence
Whether you’re a founder, operator, or investor, this financial model CLTV CAC tool brings clarity to the metrics that matter most.
As a premium subscriber (free trial available), you will also get access to the full library of resources (+50)
Download the Excel Template Below 👇
Use it. Customize it. Make it part of your monthly ritual.
Keep reading with a 7-day free trial
Subscribe to The VC Corner to keep reading this post and get 7 days of free access to the full post archives.