SaaS MRR Projection Model: Excel Template That Top SaaS Companies Use to Forecast Million-Dollar Growth
A founder-friendly guide to mastering subscription revenue forecasting using a single-sheet MRR model that turns assumptions into a clear growth roadmap.
Forecasts You Can Bet the Company On
For SaaS companies, growth isn’t always about users, but about compounding revenue. And the ability to predict that revenue, accurately and consistently, is what separates the best operators from the rest.
As a founder, you feel this pressure early. You’re hiring ahead of revenue. You’re raising capital on projections. You’re stretching cash to cover 12 months when you only have visibility for six. Most of it hinges on one shaky assumption: that your Monthly Recurring Revenue (MRR) will keep growing the way it has…
Brought to you by Carta, the End-to-End Suite Connecting Private Capital:
In today’s competitive venture climate, with LPs focused on liquidity and returns, fund managers need robust data to demonstrate their value.
Carta’s new Q2 2025 VC Fund Performance Report sets a new standard in fund administration, helping investors and managers understand how their funds stack up with the positive trends in DPI, TVPI, and IRR
MRR is where most teams lose it. They lose control because they rely on scattered dashboards, improvise churn estimates, and eyeball trends in spreadsheets. The result is growth plans based on instinct instead of insight.

A clean SaaS MRR projection model is a game-changer. This tool ties your current traction, your SaaS metrics like ARPU, churn, and new customer volume, directly to a future-facing, month-by-month view of your revenue path.
It gives founders a faster, clearer way to build conviction in their subscription revenue forecasting, without having to build a full accounting and FP&A department.
Table of Contents
1. SaaS Metrics: Your Navigation System in the Subscription Economy
2. What is the SaaS Metrics - MRR Projections Model?
3. Why This Model Matters
4. What’s Inside (The Tabs & KPIs)
5. How to Use It (3-Step Workflow)
6. Who Should Use It and When
7. Download the SaaS MRR Projection Template (Excel)
8. Frequently Asked Questions (FAQs)
1. SaaS Metrics: Your Navigation System in the Subscription Economy
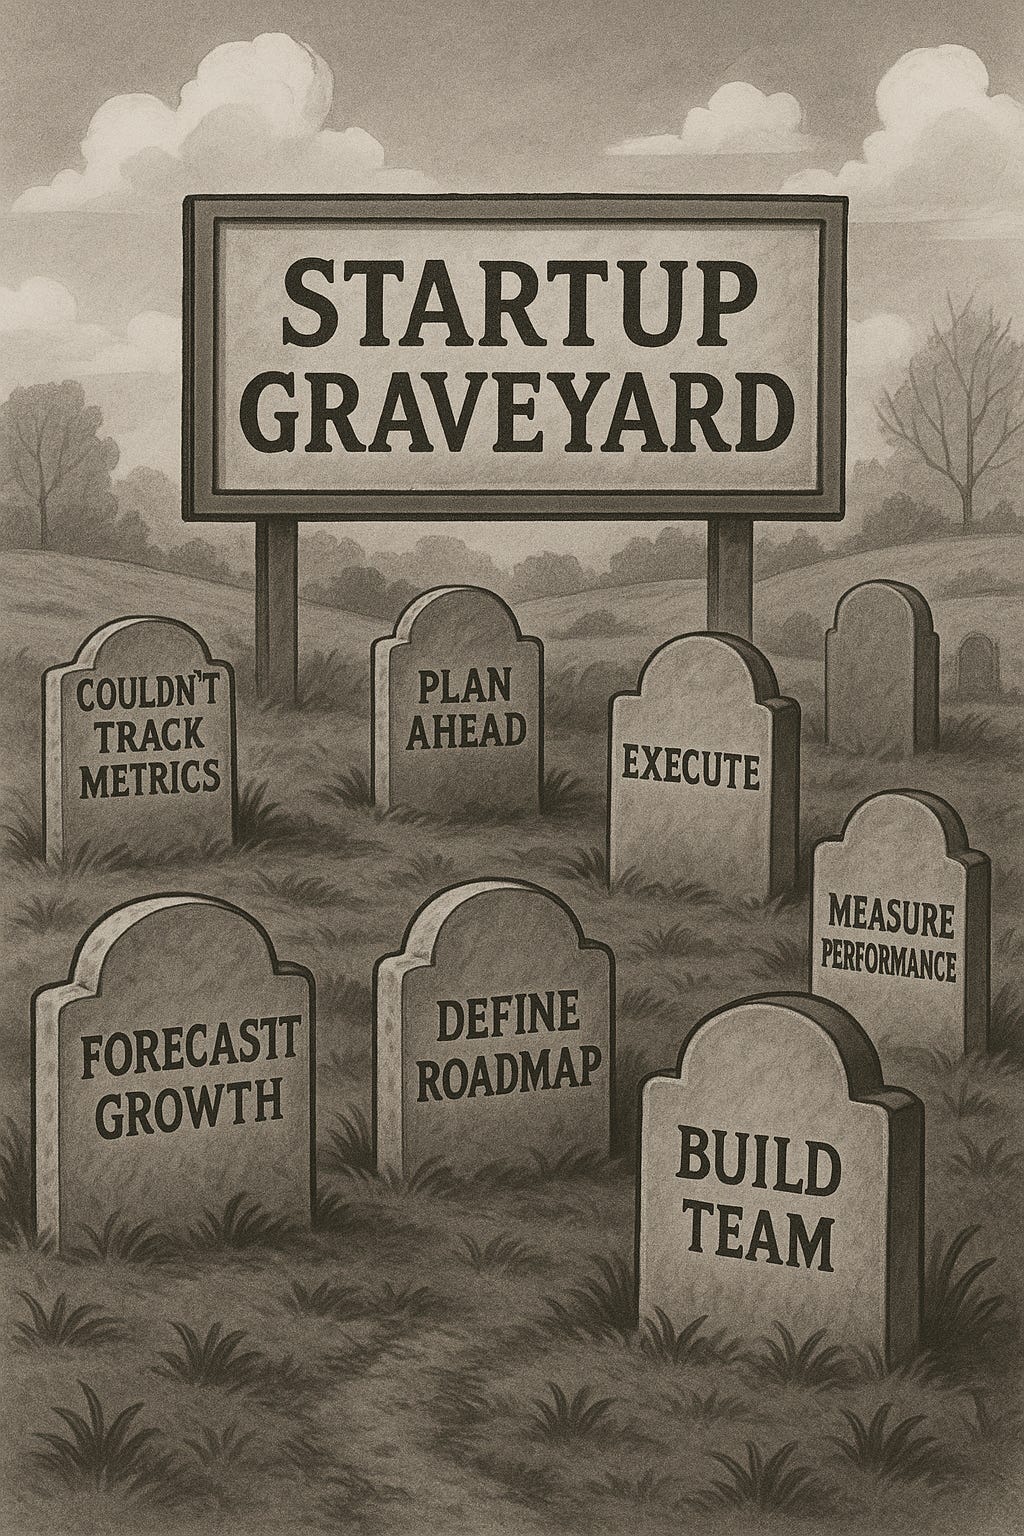
If you're trying to chart a path to sustainable growth, metrics are everything. They are your coordinates. The startup graveyard is filled with companies that burned through capital, not because they lacked product-market fit, but because they couldn’t see where they were heading.
Without clarity on the underlying metrics, even the most ambitious SaaS revenue projection spreadsheet is just a best guess.
The Core Metrics That Power the Map
To make sense of growth, and forecast it responsibly, founders need to master a small set of foundational metrics. These are the inputs that drive every serious projection model, and they underpin everything from budget planning to investor confidence.
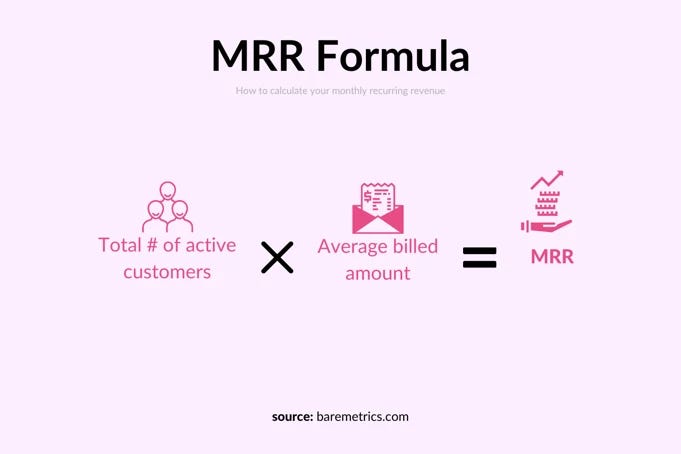
MRR (Monthly Recurring Revenue): Normalized monthly subscription revenue from all active customers. It’s the atomic unit of monthly recurring revenue forecast modeling, giving you a stable lens to view growth. Whether customers pay monthly or annually, you spread the revenue to reflect consistent intake.
ARR (Annual Recurring Revenue): This is your MRR multiplied by 12. VCs love this number for benchmarking, but it’s backward-looking. For forward planning, MRR gives you more granular control.
ARPU (Average Revenue Per User): Total MRR divided by the number of active customers. It’s extremely useful for pricing strategy and vital for ARPU and churn modeling in any template.
Churn Rate: Percentage of customers or revenue lost each month. High churn quietly erodes growth, even when acquisition looks strong. Understanding churn impact on MRR is non-negotiable.
CAC (Customer Acquisition Cost): The fully loaded cost to acquire one customer, including marketing, sales, and onboarding.
LTV (Customer Lifetime Value): ARPU multiplied by customer lifetime (1 ÷ churn). This shows how much value a customer generates over time and tells you whether CAC is justified.
Together, these metrics form the backbone of any reliable SaaS financial model template.
Metrics Are Coordinates. Projections Are the Route.
Think of metrics as GPS coordinates. They tell you where you are, not where you're going. A solid SaaS growth forecasting tool takes those inputs and maps a trajectory forward. That's what makes projection models great. They translate your present into a credible future.
This is especially important for early-stage SaaS companies, where small misjudgements in churn or ARPU can snowball into major errors in burn and hiring decisions.
Consider a startup with 5% monthly churn that assumed it would improve to 2%. That sounds small, but over 12 months, the gap could mean the difference between hitting $100k MRR and stalling out at $70k.
Or take a founder who models growth using $150 ARPU, when in reality it trends closer to $95. It changes everything. It means that the plan is bloated, the CAC payback slips, and the Series A round is delayed.
Accurate metrics are everything.
Why MRR Projections Sit at the Center
While CAC and LTV are important for long-term planning, nothing has a more immediate impact on day-to-day decisions than MRR projections. Your headcount, cash flow, fundraising runway, and pricing strategy all depend on how quickly you can grow predictable revenue.
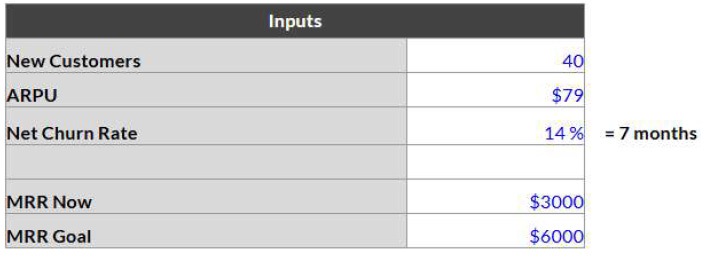
That’s why our SaaS MRR projection model begins with just five inputs: New Customers, ARPU, Net Churn Rate, MRR Now, and MRR Goal. These values encapsulate everything you need to build a month-by-month subscription revenue forecasting view that is simple enough for fast testing and robust enough for strategic decisions.
So, metrics are your coordinates and the model is your route. What’s missing is the engine that ties them together.
2. What is the SaaS Metrics - MRR Projections Model?
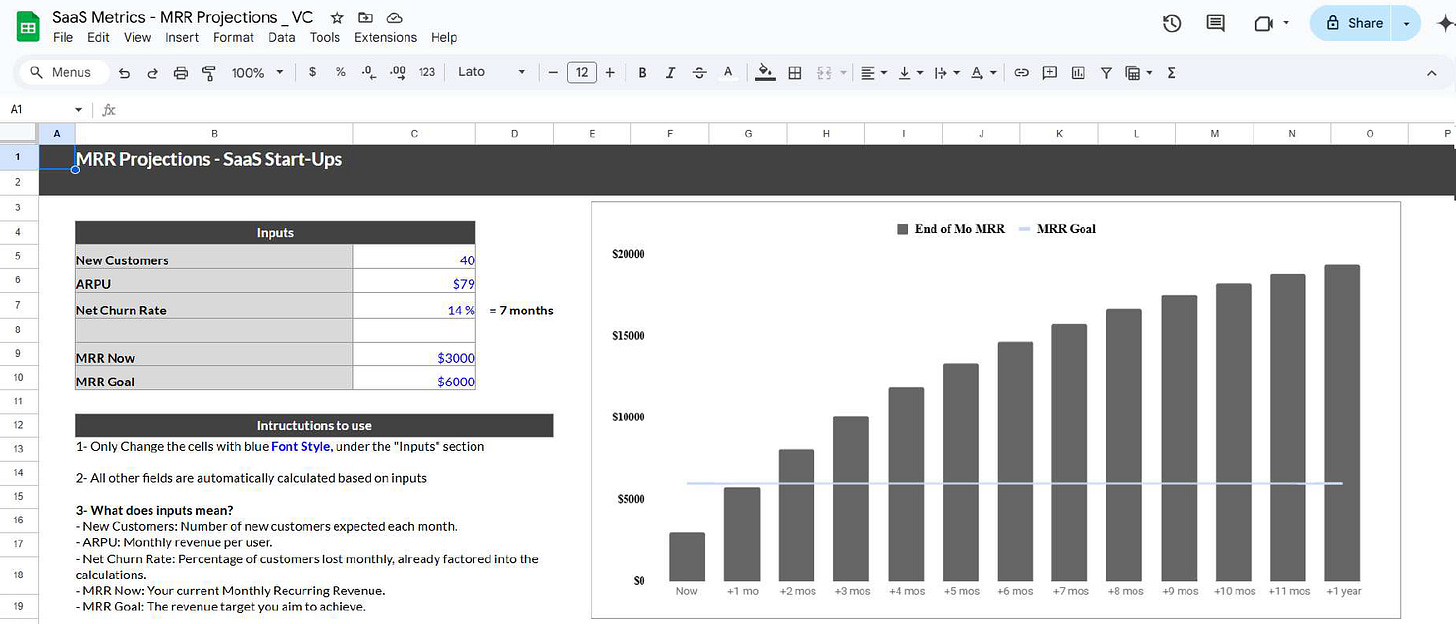
At its core, this is a single-sheet Excel tool built for clarity, speed, and action. It takes a few assumptions and turns them into a forward-looking monthly recurring revenue forecast. The best part is that no financial modelling background is required.
Here’s what it looks like in practice. You drop in:
50 New Customers per month
$100 ARPU
3% Net Churn Rate
Starting with $10k MRR and a goal of $100k MRR
Instantly, you see when you’ll cross that target, and what’s helping or slowing you along the way.
The inputs are minimal by design. It’s just five values: New Customers, ARPU, Net Churn Rate, MRR Now, and MRR Goal.
From those, the model calculates monthly gains, churned revenue, and total MRR over time. It gives you a clean, visual projection line, plus clear metrics to share with your team or board.
Unlike a full SaaS financial model template, this isn’t meant to replace your CFO’s three-tab cash flow engine. Instead, it’s built for fast scenario testing.
What happens if churn spikes? What if ARPU nudges up after a pricing change? Can we afford to hire sales before the next round?
The model answers those questions in minutes.
3. Why This Model Matters
There are moments in a startup’s life when clarity is everything. You're planning to fundraise, debating a hiring push, or trying to stretch cash until product-market fit clicks. In every case, the conversation turns to one question: how predictable is your MRR growth?
The answer will guide everything else from that point. Valuation, team size, sales targets, cash runway. And yet, too many teams rely on gut feel or overfitted models that break under real-world conditions.
That’s where this SaaS MRR projection model comes in. It provides a reliable, visual line from where you are to where you need to be, and how to get there without running out of cash or credibility.
Predictability Is the Real Growth Story
Investors don’t just look at how fast you’re growing, they look at how confidently you can repeat it. If your ARPU and churn modelling isn’t tight, projections fall apart quickly. A churn estimate that’s off by 2% can delay your MRR goal by months. A bloated ARPU assumption makes CAC payback look better than it is.
That’s why the MRR Now vs. MRR Goal view is extremely important. It anchors your growth path in the metrics that matter. It gives founders the confidence to say: “Here’s our baseline trajectory, here’s what changes if churn improves by one point.”

Act with Conviction Instead of Assumption
Picture a seed-stage SaaS startup selling into mid-market HR teams. They were closing 30 new customers a month at $120 ARPU. Their board was pushing for aggressive GTM and sales hiring. The CEO was ready to commit to 5 new reps.
Before doing so, she plugged real numbers into the model: 30 New Customers, $120 ARPU, 4.5% Net Churn Rate, and an MRR Goal of $150k. The projection showed they’d barely hit $90k in six months, not nearly enough to support the added headcount.
Instead of hiring five, they hired two. They also started A/B testing a pricing tier to move ARPU toward $150. Three months later, their actuals were beating the revised projection, and they had the confidence to scale faster without overspending.
That’s the real value of a lightweight, accurate SaaS growth forecasting tool. It helps you act with conviction instead of assumption.
4. What’s Inside (The Tabs & KPIs)
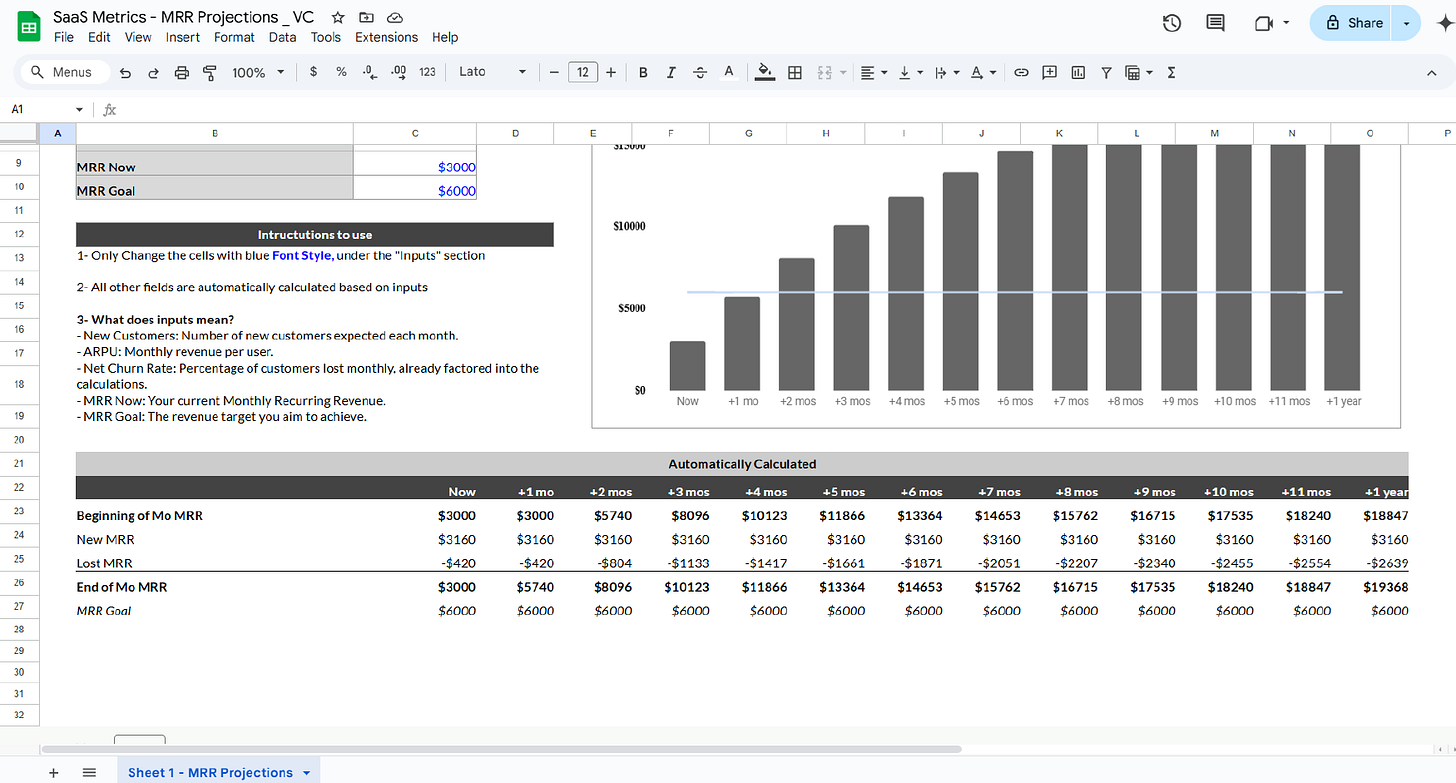
The beauty of this tool is its simplicity. Everything lives in a single tab, with clean inputs, automatic calculations, and visual clarity that makes it easy to understand and even easier to share.
At the top of the sheet, you’ll see a clearly labelled “Inputs section” highlighted in blue. These five assumptions drive the entire SaaS MRR projection model:
New Customers (per month)
ARPU (Average Revenue Per User)
Net Churn Rate
MRR Now (your current monthly recurring revenue)
MRR Goal (your target MRR milestone)
Drop in your values, and the rest of the model responds instantly.
Behind the Scenes: What Gets Calculated
Beneath the input block, the model performs automatic monthly calculations to generate your monthly recurring revenue forecast. You’ll see:
Beginning MRR: where each month starts
New MRR Added: from new customer acquisition
Churned MRR: based on your input churn rate
End-of-Month MRR: the result after growth and churn
A visual bar chart showing MRR progress toward your goal
This is where the churn impact on MRR becomes crystal clear, you’ll spot exactly where growth slows and how long it takes to cross key thresholds.
Designed for Handover and Team Use
There’s also an Instruction block at the top of the sheet. It explains the workflow step by step, so you can share the file with your co-founder, finance lead, or investor without needing to translate anything. It’s meant to be self-serve and self-explanatory.
You’ll also see a summary of key surfaced metrics:
Total MRR over time
Cumulative net growth
Time to hit goal
Highlighted moments where churn materially affects trajectory
Don’t Break the Model
Remember this one simple rule: keep assumptions and outputs separate.
Input cells are highlighted in blue. All other values are calculated automatically. Changing anything outside the input block can break the formulas, which defeats the point of having a structured MRR projection Excel template in the first place.
If you stick to the inputs, the rest of the sheet becomes a live model you can update month by month, fast enough for real-time decisions, stable enough for serious planning.
5. How to Use It (3-Step Workflow)
This model was built to be picked up and used in minutes. Whether you're running it yourself, passing it to a finance lead, or sharing it with investors, the workflow is intentionally simple. Three steps, one sheet, infinite use cases.
1. Drop Your Data
Start by filling in the five inputs in blue:
New Customers per month
ARPU
Net Churn Rate
MRR Now
MRR Goal
These assumptions power your entire SaaS MRR projection model. You don’t need to model contracts, cohorts, or billing cycles; just plug in your core growth drivers and let the sheet run.
2. Review Auto-Metrics
Once you drop your data, scroll down. The model calculates your monthly recurring revenue forecast, highlights churn’s drag on growth, and visually shows how long it will take to reach your target MRR.
Try this:
Start with 50 new customers/month, $100 ARPU, and 5% churn. You might hit $100k MRR in 12 months.
Now tweak ARPU to $125 and churn to 3%. Suddenly, you’re hitting that goal in 8 months instead, with better margins.
These small shifts tell powerful stories. The model brings those stories into view.
3. Make Decisions and Share
Once your projections are live, you can test pricing changes, acquisition goals, or customer success impact. Use the outputs to guide:
Sales hiring
Pricing strategy
CAC vs. payback period
Fundraising runway planning
If you need to present this to investors or your board, simply export the chart and summary metrics directly from the sheet. You now have a clean visual backed by real assumptions, not a hand-waved forecast.
And because the model is lightweight, it’s easy to update monthly. Just revise “New Customers”, “ARPU”, or “churn”, and track progress over time. That’s what makes it more than a one-time spreadsheet. It turns into your living SaaS founder financial planning tool.
6. Who Should Use It and When
Ultimately, this is a decision tool built for the exact moments when the stakes are high, time is short, and you need answers that don’t require a full finance team to decode.
Founders & Growth Leads
If you're setting revenue targets, building hiring plans, or pressure-testing a go-to-market motion, this model keeps your assumptions grounded. You’ll know exactly how much acquisition, retention, and ARPU growth it takes to cross the next MRR milestone. It’s your real-time SaaS growth forecasting tool.
FP&A Teams
This model is ideal for FP&A leads who want a fast, transparent way to simulate revenue paths before building a deeper model. When prepping for a fundraise or planning budget allocations, you can gut-check whether cash, hiring, and MRR growth align without needing a three-tab workbook to get started.

Investors & Advisors
For early-stage VCs and angels, the model is a quick filter. You can drop in a startup’s topline assumptions and see if the MRR trajectory holds water. It's a fast way to validate pitch math, spot overconfidence in ARPU and churn modelling, or flag misaligned expectations around timing.
When to Use It
Pre-fundraising: sanity-check your growth story before it hits the pitch deck
During budget planning: make sure spend matches revenue velocity
Before big hiring pushes: ensure MRR supports added headcount
After pricing changes: test how ARPU gains shift your path to profitability
Where traditional SaaS financial model templates are deep and detailed, this one is deliberately fast and focused. It won’t replace your full forecast, but it will get you to clarity faster, and make sure your next decisions are grounded in math and not just momentum and vibes.
7. Download the SaaS MRR Projection Template (Excel):
Yoy will also get access to the full library of RESOURCES
Keep reading with a 7-day free trial
Subscribe to The VC Corner to keep reading this post and get 7 days of free access to the full post archives.


